
This compilation of stats and figures illustrates the current housing situation, particularly for lower income households, in Manitoba. Winnipeg figures are here.
References are available at the bottom of the page, in case you are looking for more details.
Core Housing Need
Definition of Core Housing Need
“Acceptable housing is defined as adequate and suitable shelter that can be obtained without spending 30 per cent or more of before-tax household income. Adequate shelter is housing that is not in need of major repair. Suitable shelter is housing that is not crowded, meaning that it has sufficient bedrooms for the size and make-up of the occupying household. The subset of households classified as living in unacceptable housing and unable to access acceptable housing is considered to be in core housing need.”(1)
Core Housing Need
In 2006:(2)
- 11.3 % of all MB households lived in core housing need (46,900 households)
- 24.0 % of MB renter households lived in core housing need (28,800 households)
- 6.2 % of MB owner households lived in core housing need (18,100 households)
- 22.3 % of those who immigrated to Canada between 2001 and 2006 lived in core housing need in Manitoba (1,600 households)
In 2006: (3)
- 8.4 % of all Brandon households lived in core housing need (1,640 households)
- 17.4 % of Brandon renter households lived in core housing need (1,220 households)
- 3.3 % of Brandon owner households lived in core housing need (420 households)
- 9.6 % of all Thompson households lived in core housing need (460 households)
- 21.5 % of Thompson renter households lived in core housing need (420 households)
- 1.4 % of Thompson owner households lived in core housing need (40 households)
- 8.3 % of all Portage la Prairie households lived in core housing need (580 households)
- 20.7 % of Portage la Prairie renter households lived in core housing need (400 households)
- 4.2 % of Portage la Prairie owner households lived in core housing need (175 households)
- Data is not available from the 2006 Census for Selkirk.
Renting in Manitoba
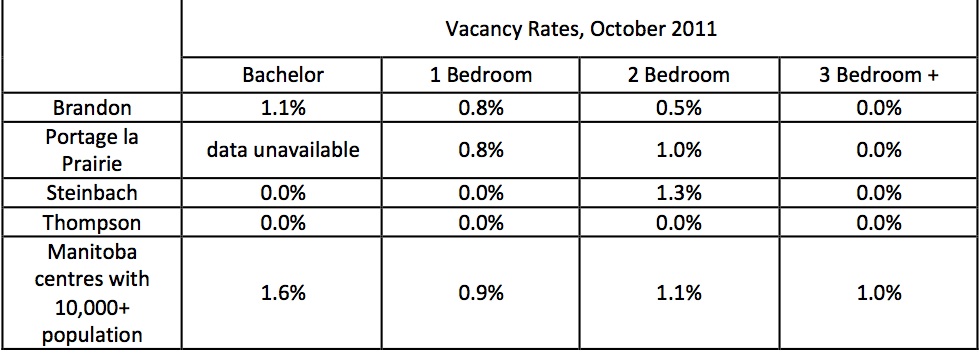
Current Vacancy Rates
In October, 2011, the vacancy rate was (4)
- 1.0 % in Manitoba, the lowest vacancy rate in the provinces
- 1.1 % in Winnipeg, the second-lowest among all CMAs in Canada
- 0.0 % in Thompson
- 0.6 % in Brandon
- 1.0 % in Portage la Prairie
Vacancy Rates, October 2011 (5)
Rents
In October 2011, the average rent was (6)

In 2011, the Median Market Rent in Manitoba was (7)

Affordability of Average Rents in Brandon (8) (9)

Affordability of Average Rents in Thompson (10) (11)

Affordability of Average Rents in Portage la Prairie (12) (13)

Affordability of Average Rents Compared with EIA Rental Allowances (6) (14)

Demographics
Migration
The population of Manitoba increased by 15,800 people from 2009-2010 (from 1,219,600 to 1,235,400).(15)
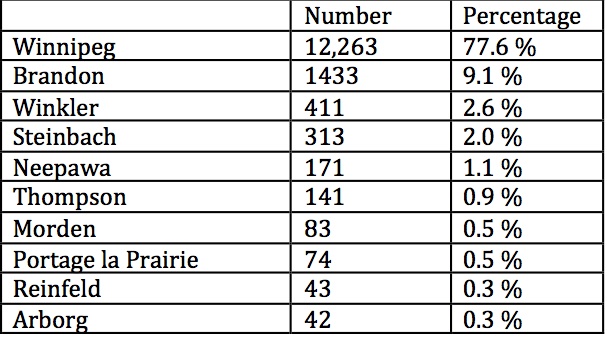
2010 immigration to centres in Manitoba (16)
Social Housing
Manitoba Housing “owns the Province’s housing portfolio and provides subsidies to approximately 34,900 households under various housing programs. Within the portfolio, Manitoba Housing owns 17,600 units of which 13,100 units are directly managed by Manitoba Housing and another 4,500 units are operated by non- profit/cooperative sponsor groups or property management agencies. Manitoba Housing also provides subsidy and support to approximately 17,300 households (including 4,700 personal care home beds) operated by cooperatives, Urban Native and private non-profit groups.” (17)
National Social Housing Construction
In 1993, the federal government withdrew from housing. Until then, about 10 percent of the housing built each year in Canada was affordable to lower income households; since then it has been less than one percent.(18) (19)

References
(1) CMHC 2011, Canadian Housing Observer.
(2) CMHC 2006, Canadian Housing Observer. Also offers data on types of family, Aboriginal status, and period of immigration.
(3) CMHC.2006. Census-based housing indicators and data. Housing in Canada Online.
(4) CMHC 2011, Fall. Rental Market Report: Manitoba Highlights.
(5) CMHC 2011, Fall. Rental Market Report: Manitoba Highlights.
(6) CMHC 2011, Fall. Rental Market Report: Manitoba Highlights.
(7) Government of Manitoba, date unknown. Housing Income Limits and Median Market Rent
(8) Statistics Canada. 2006. Profile for Census Metropolitan Areas and Census Agglomerations, 2006 Census: Brandon.
(9) CMHC 2011, Fall. Rental Market Report: Manitoba Highlights.
(10) Statistics Canada. 2006. Profile for Census Metropolitan Areas and Census Agglomerations, 2006 Census: Thompson.
(11) CMHC 2011, Fall. Rental Market Report: Manitoba Highlights.
(12)Statistics Canada. 2006. Profile for Census Metropolitan Areas and Census Agglomerations, 2006 Census: Portage la Prairie.
(13) CMHC 2011, Fall. Rental Market Report: Manitoba Highlights.
(14) Government of Manitoba. Employment and Income Assistance Facts.
(15) City of Winnipeg. 2011, May 1. Population of Winnipeg.
(16) Government of Manitoba. 2011. Manitoba Immigration Facts: 2010 Statistical Report.
(17) Manitoba Housing and Community Development. 2010. Annual Report 2009-2010.
(18) CMHC. 2011. CHS – Public Funds and National Housing Act (Social Housing).
(19) CMHC. 2011. CHS – Residential Building Activity.