Looking for information about housing in Winnipeg? Look no further – here are the updated facts and statistics about housing in Winnipeg and Manitoba. (The previous page is here).
References are available at the bottom of the page, in case you are looking for more details.
Core Housing Need
Definition of Core Housing Need
“Acceptable housing is defined as adequate and suitable shelter that can be obtained without spending 30 per cent or more of before-tax household income. Adequate shelter is housing that is not in need of major repair. Suitable shelter is housing that is not crowded, meaning that it has sufficient bedrooms for the size and make-up of the occupying household. The subset of households classified as living in unacceptable housing and unable to access acceptable housing is considered to be in core housing need.”(1)
Core Housing Need
In 2006: (2)
- 11.3 % of all MB households lived in core housing need (46,900 people)
- 24.0 % of MB renter households lived in core housing need (28,800 people)
- 6.2 % of MB owner households lived in core housing need (18,100 people)
- 22.3 % of those who immigrated to Canada between 2001 and 2006 lived in core housing need in Manitoba (1,600 people)
In 2006: (3)
- 37.3 % of Winnipeg tenant-occupied households spent over 30% of their income on housing.
- 11.6 % of Winnipeg owner-occupied households spend over 30% of their income on housing.
Renting in Manitoba
Current Vacancy Rates
In October, 2011, the vacancy rate was (4)
- 1.0 % in Manitoba, the lowest vacancy rate in the provinces
- 1.1 % in Winnipeg, the second-lowest among all CMAs in Canada
- 0.0 % in Thompson
- 0.6 % in Brandon
- 1.0 % in Portage la Prairie
Source: (5)
Winnipeg’s Rental Universe
(This data only applies to apartment buildings with three or more units)
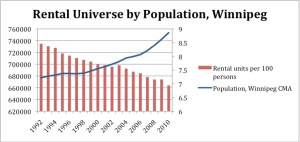
The rental universe in Winnipeg (6)
- has declined in 15 of the past 18 years.
- Lost 835 rental units, of which at least 450 units were permanently removed from the rental universe, between October 2009 and October 2010 (leaving 52,319 units).
Since 1992, Winnipeg’s rental universe has declined from 57,279 units to 52,319 in 2010, a decline of about 9 percent (7). At the same time, the population of Winnipeg has increased from 677,000 to 753,600, an increase of about 11 percent (8).
- The result is a drop in the number of rental units per 100 people from 8.5 units to 6.9.
Rents
In October 2011, the average rent was (9)
- 744 $ in Manitoba (compared with 711 $ in October 2010)
- 754 $ in Winnipeg (compared with 719 $ in October 2010)
- 683 $ in Thompson (compared with 668 $ in April 2010)
In 2011, the Median Market Rent in Manitoba was: (10)
Affordability of Average Rents in Winnipeg (11 and 12)
EIA and Rent in Winnipeg (13 and 14)
Demographics
Migration
In 2010, 15,803 international migrants came to Manitoba, and 12,340 immigrants moved to Winnipeg. (15)
The population of Manitoba increased by 15,800 people from 2009-2010 (from 1,219,600 to 1,235,400). (16)
The population of Winnipeg increased by 9,700 people from 2009-2010 (from 674,400 to 684,100). (17)
Social Housing
Manitoba Housing “owns the Province’s housing portfolio and provides subsidies to approximately 34,900 households under various housing programs. Within the portfolio, Manitoba Housing owns 17,600 units of which 13,100 units are directly managed by Manitoba Housing and another 4,500 units are operated by non- profit/cooperative sponsor groups or property management agencies. Manitoba Housing also provides subsidy and support to approximately 17,300 households (including 4,700 personal care home beds) operated by cooperatives, Urban Native and private non-profit groups.” (18)
National Social Housing Construction
In 1993, the federal government withdrew from housing. Until then, about 10 percent of the housing built each year in Canada was affordable to lower income households; since then it has been less than one percent.
Sources
(1) CMHC 2011, Canadian Housing Observer.
(2) CMHC 2006, Canadian Housing Observer. Also offers data on types of family, Aboriginal status, and period of immigration
(3) City of Winnipeg 2006. 2006 Census Data – City of Winnipeg.
(4) CMHC 2011, Fall. Rental Market Report: Manitoba Highlights.
(5) CMHC 2011, Fall. Rental Market Report: Winnipeg CMA.
(6) CMHC 2011. Rental Market Report: Manitoba Highlights.
(7) CMHC 2011. Personal communication from Dianne Himbeault, CMHC.
(8) City of Winnipeg. 2011. Population of Winnipeg.
(9) CMHC 2011, Fall. Rental Market Report: Manitoba Highlights.
(10) Government of Manitoba, date unknown. Housing Income Limits and Median Market Rent
(11) City of Winnipeg 2006. 2006 Census Data – City of Winnipeg.
(12) CMHC 2011, Fall. Rental Market Report: Winnipeg CMA.
(13) CMHC 2011, Fall. Rental Market Report: Winnipeg CMA.
(14) Employment and Income Assistance Facts. Government of Manitoba.
(15) Government of Manitoba. 2011. News and Resources.
(16) City of Winnipeg. 2011, May 1. Population of Winnipeg.
(17) City of Winnipeg. 2011, May 1. Population of Winnipeg.
(18) Manitoba Housing and Community Development. 2010. Annual Report 2009-2010.
(19) CMHC. 2011. CHS – Public Funds and National Housing Act (Social Housing).


Thanks to CCPA and Sarah for distilling the factual essence of the housing shortage out of the volumes of data and making it available in such a user-friendly way!