
Once again, here are the updated housing statistics for Winnipeg and Manitoba. References are available at the bottom of the page. Compiled by Sarah Cooper.
Core Housing Need
In 2006:(1)
- 11.3 % of all MB households lived in core housing need (46,900 households)
- 24.0 % of MB renter households lived in core housing need (28,800 households)
- 6.2 % of MB owner households lived in core housing need (18,100 households)
- 22.3 % of those who immigrated to Canada between 2001 and 2006 lived in core housing need in Manitoba (1,600 households)
In 2009:(2)
- 9.3 % of households in urban centres in Manitoba were in core housing need
- 9.5 % of households in Winnipeg were in core housing need
In 2006:(3)
- 10.4% of all Winnipeg CMA(4) households lived in core housing need (28,375 households)
- 23.9% of Winnipeg renter households lived in core housing need (20,910 households)
- 4.0 % of Winnipeg owner households lived in core housing need (7,465 households)
- 8.4 % of all Brandon CA(5) households lived in core housing need (1,640 households)
- 17.4 % of Brandon CA renter households lived in core housing need (1,220 households)
- 3.3 % of Brandon CA owner households lived in core housing need (420 households)
- 9.6 % of all Thompson CA households lived in core housing need (460 households)
- 21.5 % of Thompson CA renter households lived in core housing need (420 households)
- 1.4 % of Thompson CA owner households lived in core housing need (40 households)
- 8.3 % of all Portage la Prairie CA households lived in core housing need (580 households)
- 20.7 % of Portage la Prairie CA renter households lived in core housing need (400 households)
- 4.2 % of Portage la Prairie CA owner households lived in core housing need (175 households)
In 2006:(6)
- 37.3 % of Winnipeg tenant-occupied households spent over 30% of their income on housing.
- 11.6 % of Winnipeg owner-occupied households spend over 30% of their income on housing.
Renting in Manitoba
Current Vacancy Rates
In October 2012, the vacancy rate was (7)
- 1.8 % in Manitoba
- 1.9 % in Winnipeg CMA
- 1.6 % in Thompson CA
- 1.0 % in Brandon CA
- 3.6 % in Portage la Prairie CA


Average Rents and Median Market Rents
In April 2013, the average rent was (10)
|
Bachelor |
1-Bedroom |
2-Bedroom |
3+ Bedroom |
Total |
||||||
|
April 2012 |
April 2013 |
April 2012 |
April 2013 |
April 2012 |
April 2013 |
April 2012 |
April 2013 |
April 2012 |
April 2013 |
|
| Winnipeg CMA |
$552 |
$554 |
$697 |
$727 |
$901 |
$939 |
$1114 |
$1162 |
$776 |
$812 |
| Brandon CA |
$448 |
$468 |
$566 |
$589 |
$734 |
$773 |
$921 |
$992 |
$683 |
$720 |
| Portage La Prairie CA |
$329 |
$368 |
$519 |
$527 |
$659 |
$661 |
$659 |
$654 |
$586 |
$590 |
| Steinbach |
$478 |
$510 |
$551 |
$590 |
$710 |
$701 |
N/A |
n/a |
$659 |
$654 |
| Thompson CA |
$548 |
$630 |
$699 |
$717 |
$771 |
$790 |
$742 |
$763 |
$741 |
$759 |
| Manitoba |
$548 |
$550 |
$690 |
$718 |
$876 |
$912 |
$1078 |
$1131 |
$767 |
$800 |
Renters and Owners
In 2006, the percentage of households that owned or rented was:(11)
|
Renters |
Owners |
|
| Manitoba |
29 % |
71 % |
| Winnipeg |
32 % |
68 % |
| Brandon |
36 % |
64 % |
| Portage la Prairie |
28 % |
72 % |
| Thompson |
41 % |
59 % |
In 2006, average incomes for renter and owner households were:(12)
|
Renters |
Owners |
|
| Manitoba |
$ 35,578 |
$ 74,051 |
| Winnipeg |
$ 35,556 |
$ 80,807 |
| Brandon |
$ 36,574 |
$ 72,850 |
| Portage la Prairie |
$ 33,276 |
$ 64,524 |
| Thompson |
$ 47,689 |
$ 100,140 |
In 2013, the Affordable Rents in Manitoba were:(13)
| 1 Bedroom | 2 Bedroom | 3 Bedroom | 4 or more | |
| City of Winnipeg and catchment(14) | $665 | $856 | $1,039 | $1,250 |
| Urban/rural market areas | $560 | $705 | $954 | $1065 |
| Non-market areas | $476 | $594 | $802 | $894 |
Affordable rents are established by Manitoba Housing.
Affordability of Average Rents
Affordability of Average Rents in Winnipeg CMA
This table compares the affordability of current rents with incomes. Economic families may include single people who reduce their housing costs by living with roommates or others; households include all members. The dates for income and rent data are different, but rents have been rising much quicker than incomes.

* Includes economic families (two or more people living in the same dwelling who are related by blood, marriage, common law or adoption) and unattached individuals (people living alone or with others to whom they are not related).
Affordability of Average Rents in Brandon CA

Affordability of Average Rents in Thompson CA

Affordability of Average Rents in Portage la Prairie CA

Affordability of Average Rents Compared with EIA Rental Allowances
EIA rent allowances are based on the size of the household, rather than the size of the rental unit. This table approximates how many people could live in various apartment sizes.
|
Average Rents(23) |
||||
|
Bachelor (1 person) |
1-Bedroom (1-2 people) |
2-Bedroom (3-4 people) |
3+ Bedroom (4-6 people) |
|
| Winnipeg |
$527 |
$704 |
$911 |
$1027 |
| Brandon |
$451 |
$570 |
$749 |
$992 |
| Portage La Prairie |
$344 |
$517 |
$652 |
$656 |
| Steinbach |
$496 |
$559 |
$708 |
$926 |
| Thompson |
$653 |
$722 |
$796 |
$842 |
| EIA Rent Allowance, including heat, lights and water(24) |
$285+50 supplement |
$285-387 |
$430-$471 |
$471-$513 |
Hourly Housing Rates, Manitoba(25)
These charts show how much a household must earn per hour to afford an average rental unit in Manitoba (based on a 40-hour work week, 50 weeks of the year). The blue bars show the hourly minimum wage, EIA and EIA disability benefits (these include RentAid and federal benefits such as the Canada Child Tax Benefit, etc., where applicable. Housing benefits that only some households are eligible for, such as the Portable Shelter Benefit, are not included). The red bars show how much a household must earn per hour for the average rent to be affordable, based on the 30 percent of household income affordability benchmark.
For example, an average 1-bedroom unit in Manitoba costs $718 per month. For this to be affordable, a household must bring in $14.36 per hour.


Winnipeg’s Rental Universe
(This data only applies to apartment buildings with three or more units)
The rental universe in Winnipeg CMA
- declined in 15 of the 18 years prior to 2010(26) and increased by 250 units in 2012.(27)
- Had 52,569 units in 2012.(28)
Since 1992, Winnipeg’s rental universe has declined from 57,279 units to 52,569 in 2012, (29) a decline of about 8 percent. At the same time, the population of Winnipeg has increased from 677,000 to 762,800, (30) an increase of about 13 percent.
- The result is a drop in the number of rental units from 8.5 units to 6.9 units per 100 people.

Social Housing
Manitoba Housing “owns the Province’s housing portfolio and provides subsidies to approximately 34,900 households under various housing programs. Within the portfolio, Manitoba Housing owns 17,600 units of which 13,100 units are directly managed by Manitoba Housing and another 4,500 units are operated by non- profit/cooperative sponsor groups or property management agencies. Manitoba Housing also provides subsidy and support to approximately 17,300 households (including 4,700 personal care home beds) operated by cooperatives, Urban Native and private non-profit groups.”(31)
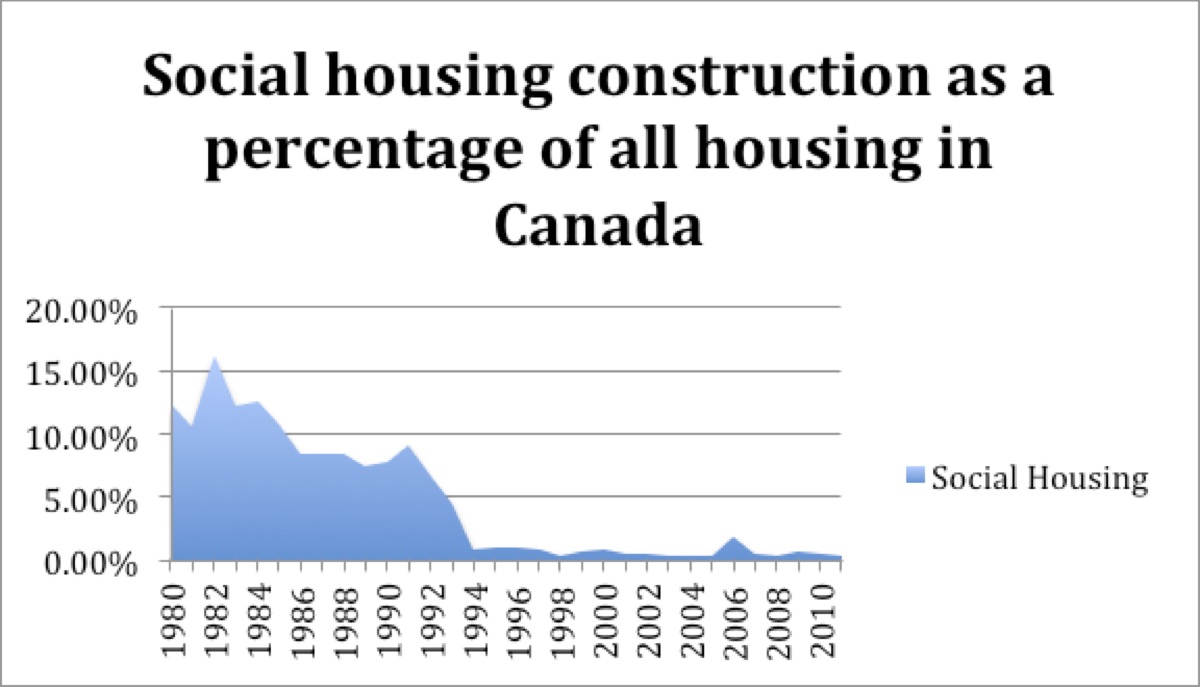
National Social Housing Construction
In 1993, the federal government withdrew from housing. Until then, about 10 percent of the housing built each year in Canada was affordable to lower income households; since then it has been less than one percent.(32)

Demographics
Migration
The population of Manitoba increased by 16,100 people from 2010-2011 (from 1,234,500 to 1,250,600).(33)
The population of the City of Winnipeg increased by 9,700 people from 2010-2011 (from 682,100 to 691,800). The population of Winnipeg’s CMA increased by 11,100 people from 2010-2011 (from 751,700 to 762,800).(34)
2010 immigration to centres in Manitoba(35)
| Number | Percentage | |
| Winnipeg | 12,263 | 77.6 % |
| Brandon | 1433 | 9.1 % |
| Winkler | 411 | 2.6 % |
| Steinbach | 313 | 2.0 % |
| Neepawa | 171 | 1.1 % |
| Thompson | 141 | 0.9 % |
| Morden | 83 | 0.5 % |
| Portage la Prairie | 74 | 0.5 % |
| Reinfeld | 43 | 0.3 % |
| Arborg | 42 | 0.3 % |
Definitions
Affordable housing: Housing that costs 30 percent or less of household income. Usually refers to housing below median rent/price; does not necessarily have any restriction on household income.
Core housing need: “Acceptable housing is defined as adequate and suitable shelter that can be obtained without spending 30 per cent or more of before-tax household income. Adequate shelter is housing that is not in need of major repair. Suitable shelter is housing that is not crowded, meaning that it has sufficient bedrooms for the size and make-up of the occupying household. The subset of households classified as living in unacceptable housing and unable to access acceptable housing is considered to be in core housing need.”(36)
Lower end of market housing: Social housing where rents are equivalent to rents for comparable units at the lower end of the private market for households that would have difficulty affording housing in the private market. Some homeownership programs focus on this area.
Public housing: housing that is owned by Manitoba Housing and rented at a subsidized rate, for households with limited or fixed incomes.
Rent geared to income housing: Housing where the rent charged is set at a proportion of household income (usually 25-30 percent) for households with limited or fixed incomes.
Social housing: A broader term that includes housing owned by Manitoba Housing as well as housing owned by non-profit organizations, that is rented at a subsidized rate for households with limited or fixed incomes.
(1) CMHC. 2009. Canadian Housing Observer. Also offers data on types of family, Aboriginal status, and period of immigration.
(2) CMHC 2012. Canadian Housing Observer. www.cmhc-schl.gc.ca
(3) CMHC. 2006. Census-based housing indicators and data. Housing in Canada Online. cmhc.beyond2020.com/HiCOLegal_EN.html
(4) CMA – Census Metropolitan Area. “The Winnipeg Census Metropolitan Area (CMA) is an economic region defined by Statistics Canada. After each national census, Statistics Canada analyzes socioeconomic information to determine which neighbouring municipalities should be included as part of the CMA. The primary criteria for inclusion in the CMA is having over half of the municipality’s labour force working in the core city (Winnipeg). The Winnipeg CMA currently includes the City of Winnipeg and the municipalities of West St. Paul, East St. Paul, Headingley, Richot, Tache, Springfield, Rosser, St. Francois Xavier, St. Clements, and the Brokenhead First Nation.” (City of Winnipeg, 2012. Description of Geographies Used to Produce Census Profiles. winnipeg.ca/census/includes/Geographies.stm)
(5) CA – Census Agglomeration. Much like a CMA, but at a smaller scale.
(6) City of Winnipeg and Statistics Canada. 2006. 2006 Census Data – City of Winnipeg. www.winnipeg.ca
(7) CMHC. 2013, Spring. Rental Market Report: Manitoba Highlights. www.cmhc-schl.gc.ca
(8) CMHC. 2013, Spring. Rental Market Report: Manitoba Highlights. www.cmhc-schl.gc.ca
(9) CMHC. 2012, Fall. Rental Market Report: Winnipeg CMA. www.cmhc-schl.gc.ca
(10) CMHC. 2013, Spring. Rental Market Report: Manitoba Highlights. www.cmhc-schl.gc.ca
(11) CMHC. 2006. Census-based housing indicators and data. Housing in Canada Online. cmhc.beyond2020.com/HiCOLegal_EN.html
(12) CMHC. 2006. Census-based housing indicators and data. Housing in Canada Online. cmhc.beyond2020.com/HiCOLegal_EN.html
(13) Government of Manitoba, date unknown. Rental Housing Programs. www.gov.mb.ca/housing/hil.html#mmr
(14) The City of Winnipeg and catchment includes a number of communities around Winnipeg. The urban/rural market areas include the other major towns in Manitoba and their surrounding areas, and the non-market areas include the rest of the province. For a complete list, please see www.gov.mb.ca/housing/hil.html
(15) City of Winnipeg and Statistics Canada. 2006. 2006 Census Data – City of Winnipeg. www.winnipeg.ca
(16) Statistics Canada. No date. Table 202-0401: Distribution of total income, by economic family type, 2010 constant dollars (table). CANSIM (database). www5.statcan.gc.ca/cansim/a26
(17) Statistics Canada. 2006. Profile for Census Metropolitan Areas and Census Agglomerations, 2006 Census: Brandon. www.statcan.ca
(18) CMHC. 2013, Spring. Rental Market Report: Manitoba Highlights. www.cmhc-schl.gc.ca
(19) Statistics Canada. 2006. Profile for Census Metropolitan Areas and Census Agglomerations, 2006 Census: Thompson. www.statcan.ca
(20) CMHC. 2013, Spring. Rental Market Report: Manitoba Highlights. www.cmhc-schl.gc.ca
(21) Statistics Canada. 2006. Profile for Census Metropolitan Areas and Census Agglomerations, 2006 Census: Portage la Prairie. www.statcan.ca
(22) CMHC. 2013, Spring. Rental Market Report: Manitoba Highlights. www.cmhc.schl.gc.ca
(23) CMHC. 2012, Spring. Rental Market Report: Manitoba Highlights. www.cmhc-schl.gc.ca
(24) Employment and Income Assistance Facts. Government of Manitoba. www.gov.mb.ca/fs/eiafacts/rental.html
(25) Based on data from:
Province of Manitoba. 2012. Fact Sheet: What is Minimum Wage? www.gov.mb.ca/labour/standards/doc,minimum-wage,factsheet.html
Province of Manitoba. 2011. Employment and Income Assistance for Single Parents. www.gov.mb.ca/fs/assistance/eia.html
Province of Manitoba. 2011. Employment and Income Assistance for the General Assistance Category. www.gov.mb.ca/fs/assistance/eia.html
CMHC. 2012, Spring. Rental Market Report: Manitoba Highlights. www.cmhc-schl.gc.ca
(26) CMHC 2010. Rental Market Report: Winnipeg CMA. www.cmhc-schl.gc.ca
CMHC 2011. Rental Market Report: Winnipeg CMA. www.cmhc-schl.gc.ca
(27) CMHC 2012. Rental Market Report: Winnipeg CMA. www.cmhc-schl.gc.ca
(28) CMHC 2012. Rental Market Report: Winnipeg. www.cmhc-schl.gc.ca
(29) CMHC. 2011. Personal communication from Dianne Himbeault; CMHC 2012. Rental Market Report: Winnipeg CMA.
(30) City of Winnipeg. 2012, March 16. Population of Winnipeg. www.winnipeg.ca/cao/pdfs/population.pdf
(31) Manitoba Housing and Community Development. 2010. Annual Report 2009-2010. www.gov.mb.ca/finance/pdf/annualrep/2009_10/housing.pdf
(32) Based on Michael Shapcott (Wellesley Institute)’s work, and data from:
CMHC. 2011. CHS – Public Funds and National Housing Act (Social Housing). cmhc.ca/en/hoficlincl/homain/stda
CMHC. 2011. CHS – Residential Building Activity. cmhc.ca/en/hoficlincl/homain/stda
(33) City of Winnipeg. 2012, March 16. Population of Winnipeg. www.winnipeg.ca/cao/pdfs/population.pdf
(34) City of Winnipeg. 2012, March 16. Population of Winnipeg. www.winnipeg.ca/cao/pdfs/population.pdf
(35) Government of Manitoba. 2011. Manitoba Immigration Facts: 2010 Statistical Report. www.immigratemanitoba.com/department/publications/
(36) CMHC. 2011. Canadian Housing Observer.